Hematology White Paper - The Influence of RBC Counting Technology on MCHC Results
Download PDF
The value-driven laboratory
The Influence of RBC Counting Technology on MCHC Results
The manufacturers of hematology analyzers use
varied technologies to count and size red blood cells.
Technological differences, including the detection
system, diluent reagent chemistry variation and
parameters being directly measured or calculated,
can all have an impact on results. It is important to be
familiar with the technology used on a hematology
analyzer and how it can impact red blood cell counting
and sizing measurements in both normal and
abnormal samples.
RBC Indices: A Historical Perspective
Maxwell Wintrobe invented the first reliable
hematocrit measurement around 1929. Dr. Wintrobe
subsequently investigated the relationship of
normal red cell measurements (RBC, hematocrit
and hemoglobin) and developed the red blood cell
indices – MCV, MCH, and MCHC. The mathematical
calculations used to obtain the red blood cell indices
can be found in any hematology textbook. At the time,
because of the lack of calculators and analyzers that
calculate the indices automatically, laborious manual
calculations needed to be performed to determine
the red blood cell indices. Because of the known
relationship between normal red cell measurements, a
quick shortcut that could easily be done in one’s head
was developed. This quick shortcut became known as
the “Rules of Three”.
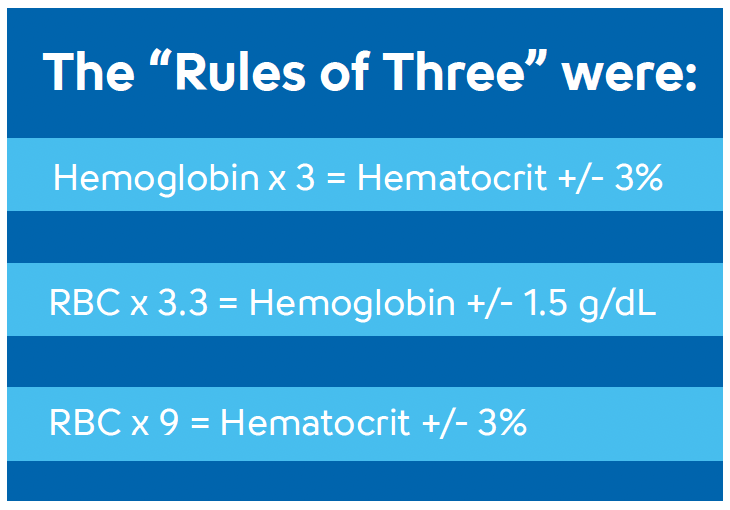
For many years the “Rules of Three” were used to compare the RBC, hemoglobin and hematocrit measurements because it was easier than calculating the indices. The “Rules of Three” helped to determine if the red blood cells were normal in size and hemoglobin content, abnormal in size and hemoglobin content or if there was an analytical error with one of the three measurements. Unfortunately, some hold onto the “Rules of Three” concept even though current hematology instrumentation automatically calculate and report the red blood cell indices. Some individuals erroneously expect every sample to follow the “Rules of Three”. What is often lost in the history of the “Rules of Three” is that they only work when the red blood cells are normal. That is exactly what Dr. Wintrobe discovered: there is a relationship between red cell measurements when the red cells are normal in size and hemoglobin content. Thus, patients with microcytic or macrocytic RBCs cannot be expected to follow the “Rules of Three”. The “Rules of Three” were developed because RBC indices were not readily available. RBC indices are routinely reported by automated hematology analyzers and it is time to leave the “Rules of Three” to the history books.
Detection System
Cell counting has its origins in electrical impedance.
Classic impedance counting pulls diluted cells through
the sensing zone of an aperture by applying a vacuum
force to the back of the aperture. There are well
documented limitations inherent in classic impedance
counting which can affect cell counting and sizing.
These limitations include:
- Coincidence (two or more cells passing through the aperture simultaneously)
- Non-axial passage (a cell that does not pass straight through the aperture)
- Recirculation (a cell which recirculates after counting, back into the aperture sensing zone being recounted)
- Deformation of the cell as it is pulled by vacuum through the aperture. (This is especially problematic with abnormal red blood cells. This may result in artificially decreased hematocrit results and artificially increased MCHC results.)
Example A (see PDF):
Most cells are pulled through the center of the
aperture and counted and sized accurately.
Example B (Non Axial Passage):
Some cells are pulled through the aperture near
the edge of the aperture sensing zone rather than
through the center of the aperture. When this
occurs, the cells spend more time in the sensing
zone and appear larger than their actual size. While
the cell is counted correctly, it is not sized correctly.
Example C (Recirculation):
After passing through the aperture, some cells
recirculate back into the sensing zone. These cells
are erroneously counted again, and because they
have spent little time in the sensing zone, are
erroneously measured as very small cells.
Example D (Coincidence):
Multiple cells can pass through the aperture
simultaneously. This is a well-known limitation
referred to as coincidence. When two or more
cells pass through the aperture together, they are
erroneously measured as one big cell. Coincidence
is a statistically predictable phenomenon related to
the cell count – the higher the cell count, the more
likely cells will go through the aperture two or more
cells at a time. Because coincidence is statistically
predictable, the cell count can be mathematically
corrected and an accurate result obtained. Although
the cell count can be corrected mathematically for
coincidence, cell sizing cannot be corrected.
Various methods have been devised to decrease the impact of these limitations on the accuracy of red cell counting and sizing.
These include:
- Mathematical correction for coincidence
- Pulse height editing (Eliminating aberrant data, such as with examples B, C and D, from the RBC size determination)
- Eliminating cell recirculation by passing a stream of fluid or placing a physical barrier behind the aperture to keep cells away from the sensing zone.
- Smaller aperture size to force more cells toward the center of the sensing zone.
While these methods provide some improvement to classic impedance counting, they cannot completely overcome the limitations associated with correctly sizing the red blood cells.
Otical particle counting is a more recent technology. To count cells optically, it is necessary to control the number of cells and their orientation as they are measured as well as to modify the cell for optimal detection. Controlling the orientation of cells as they are measured is done using the principle of hydrodynamic focusing. With hydrodynamic focusing, a stream of sheath reagent forces the cells to enter the measurement zone in a single file pattern. Hydrodynamic focusing allows for cells to be analyzed individually without the limitations associated with classical electrical impedance counting such as coincidence, nonaxial passage, recirculation or cell deformation. Modifications which enhance optical detection include staining of cells or sphering of cells by the diluent reagent to increase the amount of light they scatter.
Sysmex hematology analyzers use electrical impedance with hydrodynamic focusing to count and size red blood cells and overcome the limitations associated with classic impedance counting. Rather than pulling cells through the aperture with vacuum, cells are surrounded by a stream of sheath fluid. The sheath fluid forces the cells to pass through the aperture single file by guiding them individually. This eliminates the error associated with coincidence, nonaxial passage and recirculation of cells after counting. Cells are maintained close to their natural size and appearance in the plasma and not deformed by vacuum as they pass through the aperture or from sphering of cells to enhance detection. This allows for accurate determination of hematocrit and MCHCs in both normal and abnormal samples.
Hydrodynamically Focused
Impedance Counting
Impact of Hydrodynamic Focusing and RBC
Deformability on RBC Counting and Sizing.
Normal Red Blood Cells
Normal RBCs, when pulled through an aperture,
deform a predictable amount. They become a little
more streamlined and pass through the aperture at
a predictable rate. Since RBC size measurements are
related to the time a cell takes to pass through the
sensing zone, the predictable rate is important. This is
why non-axial passage causes normal cells to appear
abnormally large. The cells remain in the sensing zone
longer than they should be.
Hydrodynamic focusing assures all the cells pass through the center of the aperture. Hypochromic RBCs pulled through an aperture and exposed to the same shear force will deform more than normal RBCs because they lack the normal amount of hemoglobin. Hypochromic RBCs pass through the aperture more quickly which results in an underestimation of their size. Since the size of the cells is underestimated, the hematocrit will be decreased and the MCHC increased.
Hypochromic Red Blood Cells
The opposite is true with hyperchromic RBCs. Because
hyperchromic RBCs deform less than normal RBCs,
they take longer to pass through the aperture. This
results in an overestimation of cell size because they
passed through the sensing zone more slowly than
they should have. The resultant hematocrit will be
increased and the MCHC decreased.
Hydrodynamic focusing controls the shear force and speed of passage of cells through the aperture, minimizing cell deformability regardless of the hemoglobin content. Thus the cell size is accurately measured in both normal and abnormal red blood cells. This allows an MCHC determination that reflects the true physiologic range seen.
Diluent Reagent Chemistry Variation
For electrical impedance counters to function
properly, the diluent reagent must conduct electricity
and stabilize the cells during the counting process. Manufacturers employ diluent reagents with varying
osmolality and components to stabilize the cells
during the counting process. These varying reagent
chemistry characteristics can impact the final cell
sizing results, particularly in abnormal samples or
old blood.
Sysmex CELLPACK™ DCL has an osmolality of approximately 250 mOsm/kg. This means a normal cell, which has a slightly higher osmolality, takes water in. The MCV rises, but the rise is insignificant. This slight rise in cell volume can be compensated for in the calibration of the hematocrit. The advantage of this method is better separation of the RBC and PLT populations during the counting and sizing process.
Other vendors can employ diluents with higher osmolality than normal plasma. When cells are exposed to this more hypertonic diluent, they will lose water and shrink slightly. While this effect is compensated for by calibration, the compensation is in the opposite direction compared to that of Sysmex analyzers.
If the osmolality of the sample is pathologically high (>350 mOsm/kg) from electrolyte imbalances, hyperglycemia or from drugs which impact plasma osmolality, the MCV may be falsely increased and the MCHC falsely decreased due to the relative hypotonic solution compared with the hypertonic cell concentration. In samples where this interference is suspected, dilution of the sample with CELLPACK DCL followed by room temperature incubation for ten to fifteen minutes prior to reanalysis is helpful. This allows the cells to equilibrate with the CELLPACK DCL so correct MCV and MCHC results can be obtained.
Impact of Electrolyte Abnormalities on MCHC Determination
Example A1 (see PDf) shows the initial run of a sample from a patient with severe hypernatremia. The MCV is 100.8 fl and
the MCHC is 28.1 g/dL. While anemias may have microcytic/hypochromic cells or microcytic/normochromic
cells, they generally do not have macrocytic/hypochromic cells. Thus the indices on this patient do not make
sense. When pre-diluted with CELLPACK DCL diluent and allowed to equilibrate for 15 minutes, the RBC
measurements change dramatically. The pre-diluted/equilibrated results (Example A2) show an MCV of 88 fl
and an MCHC of 31.9 g/ dL.
Why does this occur? RBCs must adjust to their environment to survive. When a patient has a severe electrolyte imbalance, the plasma environment is no longer normal. For instance, when the plasma sodium is high, the RBCs must adjust to this environment by expelling water and concentrating their sodium content to match the in vivo environment. So neither the RBCs nor the plasma is what one would call ‘isotonic’. When these RBCs are put in a near isotonic environment such as CELLPACK DCL, they quickly adjust to the new Sysmex recommends that each laboratory environment. The new environment is no longer a establish its own expected reference high sodium environment and the cells rapidly take intervals based upon the laboratory’s patient population. in fluid to adjust and lower their sodium content. Individuals that have an MCHC slightly higher However, because cell counts on automated than 36.0 g/dL often tend to be healthy young males who have a hemoglobin result that analyzers are performed rapidly, the cells do not is near the high end of the reference range. Example B1 shows results from a normal 19 have time to completely equilibrate before being year old male with a hemoglobin of 16.1 g/dL counted. This causes the MCV and HCT to be and a MCHC of 36.4 g/dL. Diluting this sample and allowing the red artificially elevated and the MCHC to be decreased. blood cells time to equilibrate does nothing to Pre-diluting the sample with CELLPACK DCL and change the results – they are essentially the same. Although some laboratorians may be giving the RBCs time to equilibrate to the more more comfortable reporting a MCHC that is less than 36 g/dL, there is no clinical difference normal environment allows the cells to stabilize to between a MCHC of 36.4 g/dL or 35.7 g/dL. their actual size.
Hyponatremia will have the opposite effect. The RBCs take in water to dilute their internal content and equilibrate to the in vivo environment. When these RBCs are put in a near isotonic environment such as CELLPACK DCL, they quickly try to adjust Example B1: Healthy 19 year old male, initial run to the new environment. The environment is no longer a low sodium environment, so the cells rapidly expel fluid to adjust and increase their sodium content and equilibrate with the now isotonic environment. Again, because of the speed of the analyzer cell analysis, these RBCs do not have time to fully equilibrate. This results in an artificially decreased MCV/HCT and an elevated MCHC. Again, pre-diluting the sample with CELLPACK DCL and allowing the RBCs time to equilibrate will allow the cells to stabilize to their actual size.
A patient’s state of hydration can also impact the MCHC result. The fact that many patients are fasting when their blood is drawn adds the complication that they may be somewhat dehydrated. Red blood cells from patients who are severely dehydrated, common in patients who present to the Emergency Department, can cause the MCHC to approach or go slightly beyond 36.0 g/dL
Measured Versus Calculated
Parameters
Hematocrit is a function of the number of red
blood cells and the size of the red blood cells. Most
hematology analyzers calculate hematocrit using
the following equation: HCT% = (RBC x MCV)/10
Sysmex hematology analyzers directly measure hematocrit by adding up the cumulative number and heights of the pulses determined during the RBC counting process. This correlates more closely with the reference micro-hematocrit method than other methods which calculate the hematocrit.
MCHC Reference Range Information
A reference range study conducted on a Sysmex
analyzer with hydrodynamically focused impedance
technology using samples from 850 normal, healthy
blood showed a range of 32.0 to 36.4 g/dL (central
95%). As this range was determined from the central
95%, 5% of these normal healthy individuals had
MCHC results of less than 32.0 or greater than
36.4 g/dL.
Sysmex recommends that each laboratory establish its own expected reference intervals based upon the laboratory’s patient population. Individuals that have an MCHC slightly higher than 36.0 g/dL often tend to be healthy young males who have a hemoglobin result that is near the high end of the reference range.
Summary
The use of electrical impedance with hydrodynamic
focusing, using diluent closer to normal plasma
osmolality and directly measuring hematocrit will
result in a wider dynamic range for MCHC results on
Sysmex systems when compared to systems that use
classic electrical impedance. This is more apparent
with abnormal samples because the cells are not being
distorted during the counting process. The net effect is
hematocrit and MCHC results that more closely correlate
to reference methods regardless of patient condition.
References
1. Sysmex XN-L Series Flagging Interpretation Guide,
February 2019.
2. XN-Series Automated Hematology Systems Flagging
Interpretation Guide, February 2019.
3. Bessman, J.D., Automated Blood Counts and
Differentials, A Practical Guide, Johns Hopkins
University Press, 1986
4. Wintrobe, M., Greer, J., Wintrobe’s Clinical
Hematology, 12th edition, Lipinncott, Williams &
Wilkins, 2008.
5. Mohandas, N., Clark, M.R., “Inaccuracies associated
with the automated measurement of mean cell
hemoglobin concentration in dehydrated cells”,
Blood, Volume 56, 1980.
Sigue leyendo Download PDF